Tracking Email Campaign Performance in Airtable using Zapier Integrations
You know the feeling. You hit send on the campaign. Open your email client. Refresh. Refresh again. Did it work? You're flying blind, relying on gut checks and hope. It's exhausting. Here's the thing: your email platform's native analytics are fine for a quick glance, but they live in a silo. They don’t talk to your other tools. What if you could see all that data—the opens, the clicks—live inside the same Airtable base where you manage your leads and projects? That's where the magic starts.
Zapier is Your Data Courier

Think of Zapier as your personal, tireless data messenger. It doesn't process or store your info. It just sees something happen in one app (like a new email open in Mailchimp) and runs to tell another app about it (like your Airtable). No complex code. No API headaches. Just a simple "when-this-then-that" logic that bridges the gap. You're not building a spaceship. You're just connecting two apps that absolutely should have been talking to each other already.
Building the Connection: A Practical Walkthrough
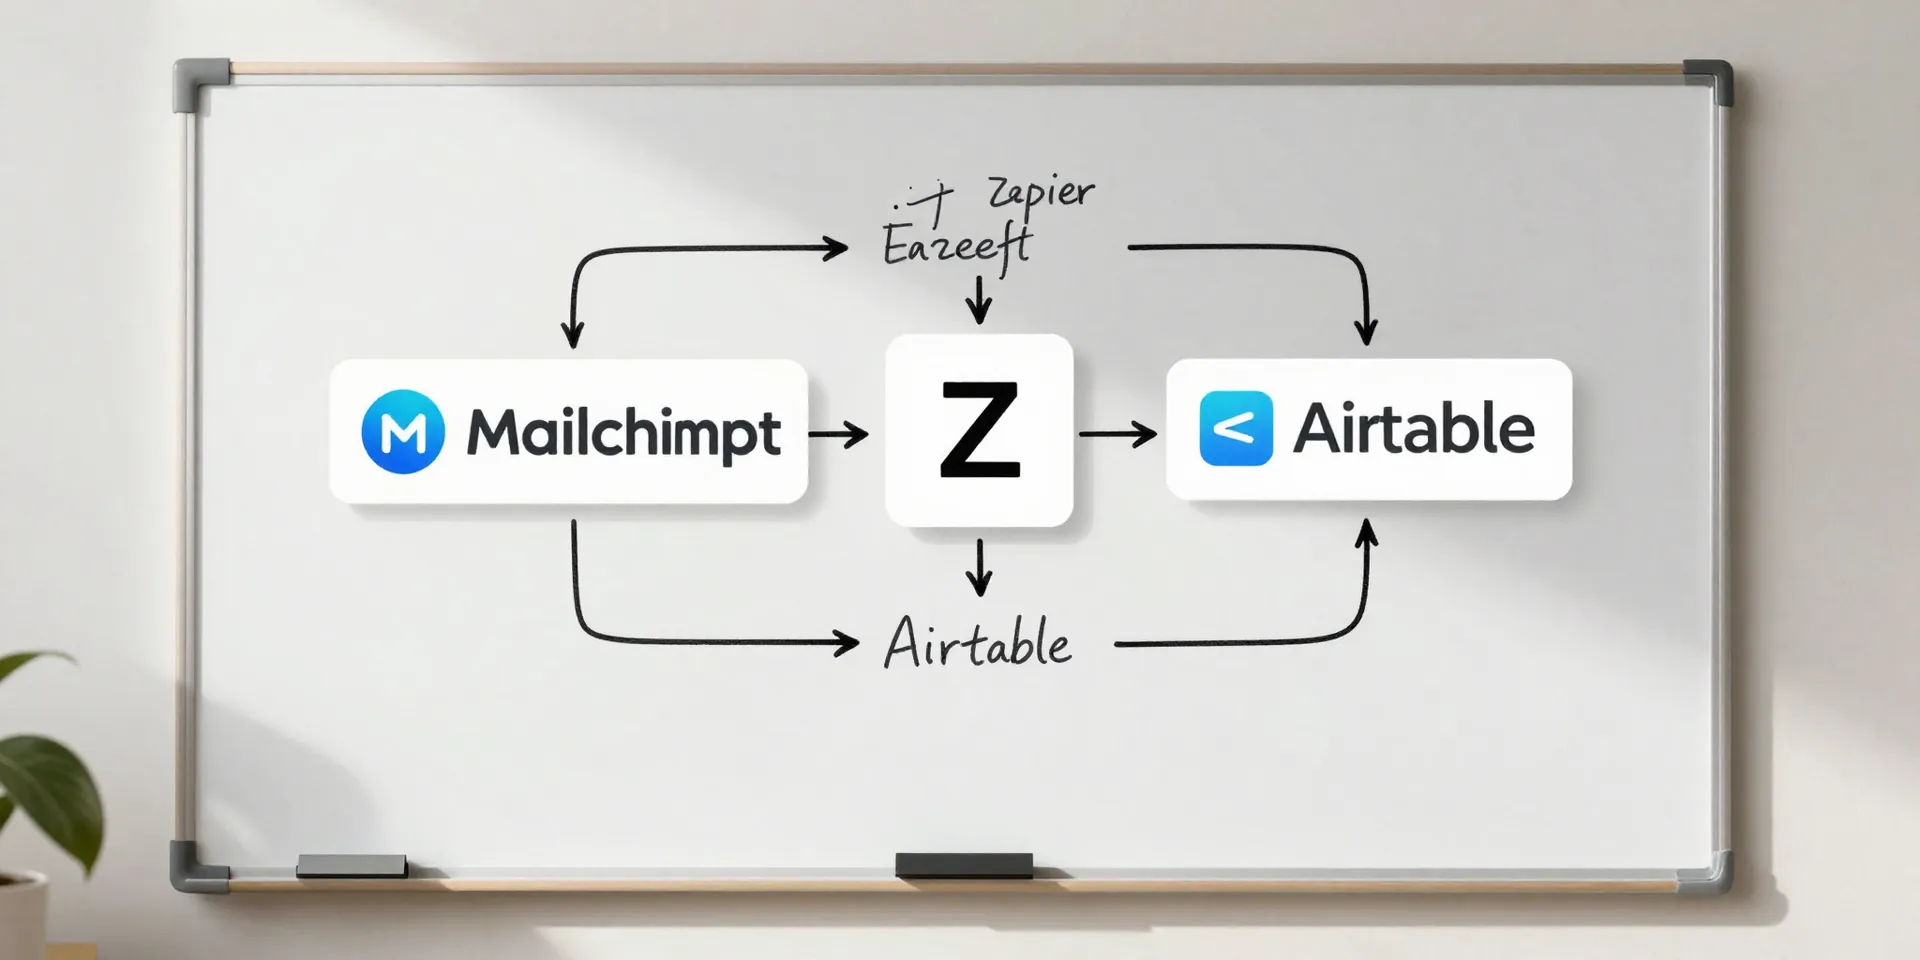
Let's get our hands dirty. First, in your Airtable base, make a table called "Campaign Performance." Add fields for: Campaign Name, Subject Line, Send Time, Open Rate, Click Rate. Simple. Now, go to Zapier. Create a new Zap (that's what they call an automation).
Trigger App: Your email service (Mailchimp, ConvertKit, etc.).
Trigger Event: "Campaign Sent" or "Subscriber Opened."
Action App: Airtable.
Action Event: "Create Record" or "Update Record."
Zapier will guide you to map the data. Map the campaign name from Mailchimp to the "Campaign Name" in Airtable. Map the open rate percentage. Hit test. You just auto-logged your first campaign result. See? Not so scary.
What to Actually Track (Hint: Not Everything)
Vanity metrics are a trap. A 40% open rate is useless if no one clicked. Stop obsessing over one number. Actually track the relationship between numbers. That's your real performance. Here’s the golden trio to sync: 1) Open Rate (Is your subject line working?). 2) Click-Through Rate (CTR) (Did your content resonate?). 3) Unsubscribes (Are you annoying people?). Send these to Airtable. Now you can sort. Which subject line had the highest open rate? Which campaign had a great open rate but terrible clicks? That table tells a story your email provider's dashboard never could.
From Static Table to Live Marketing Hub
This is where it gets fun. Your Airtable base is now a living source of truth. You can build views: "Top 5 Campaigns by CTR." You can create a dashboard with charts. But wait. Now that the data is IN Airtable, you can use MORE Zaps. Automatically post a Slack message to your #marketing channel when a campaign CTR exceeds 5%. Auto-add low-performing campaigns to a "Review" view. You just turned a simple log into an automated reporting engine that nudges you where you need to look. The data works for you, not the other way around.
Your Next Step is Smaller Than You Think
Don't try to automate everything on day one. That's how projects die. Pick one thing. The next campaign you send. Set up one Zap to just log the open rate. Just one. Live with it for a week. See how it feels to have that data waiting for you, neatly tucked into your workflow. You'll immediately see what to fix next. The power isn't in some mega-complicated setup. It's in the simple, consistent act of getting the data out of the black box and onto your own terms.